Examine Ada, C or C++ applications via scheduling visualization
Understanding your application’s scheduling behavior can help you troubleshoot scheduling issues. RapiTask automatically collects information during program execution, presenting this data so you can follow the eventsthat occurred in the test run.
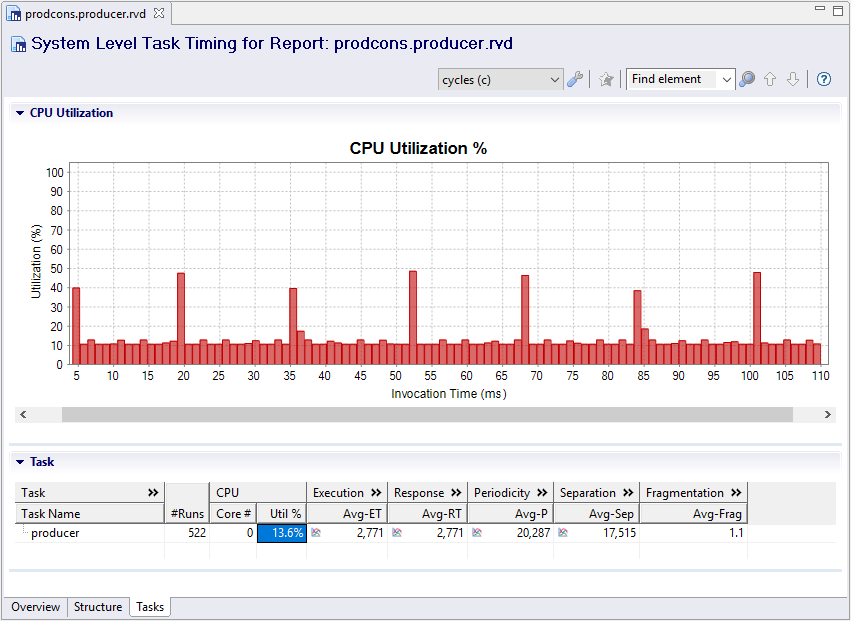
Providing a timeline of the tasks that ran in your system, a wealth of charts and statistics, RapiTask lets you analyze your system’s scheduling behavior in-depth.
Locate rare timing events that need attention
RapiTask makes it easy to find rare timing events such as priority inversions in your system so you can fix them. By following your system’s tasks throughout execution, you can easily locate rare timing events, whichcan be visualized easily for example by color coding tasks according to priority.
You can also verify that your highest priority tasks aren’t pre-empted at a glance by using fragmentation charts and statistics.
Identify bottlenecks in your application by analyzing capacity issues
Bottlenecks in critical software can slow the system down or even cause it to fail as timing deadlines are missed. By letting you view the CPU utilization of each task in your system throughout your software execution,RapiTask helps you identify bottlenecks so you can fix them.